Blog post
The Paywall Experiment Velocity Gap: Blame the Release Cycle
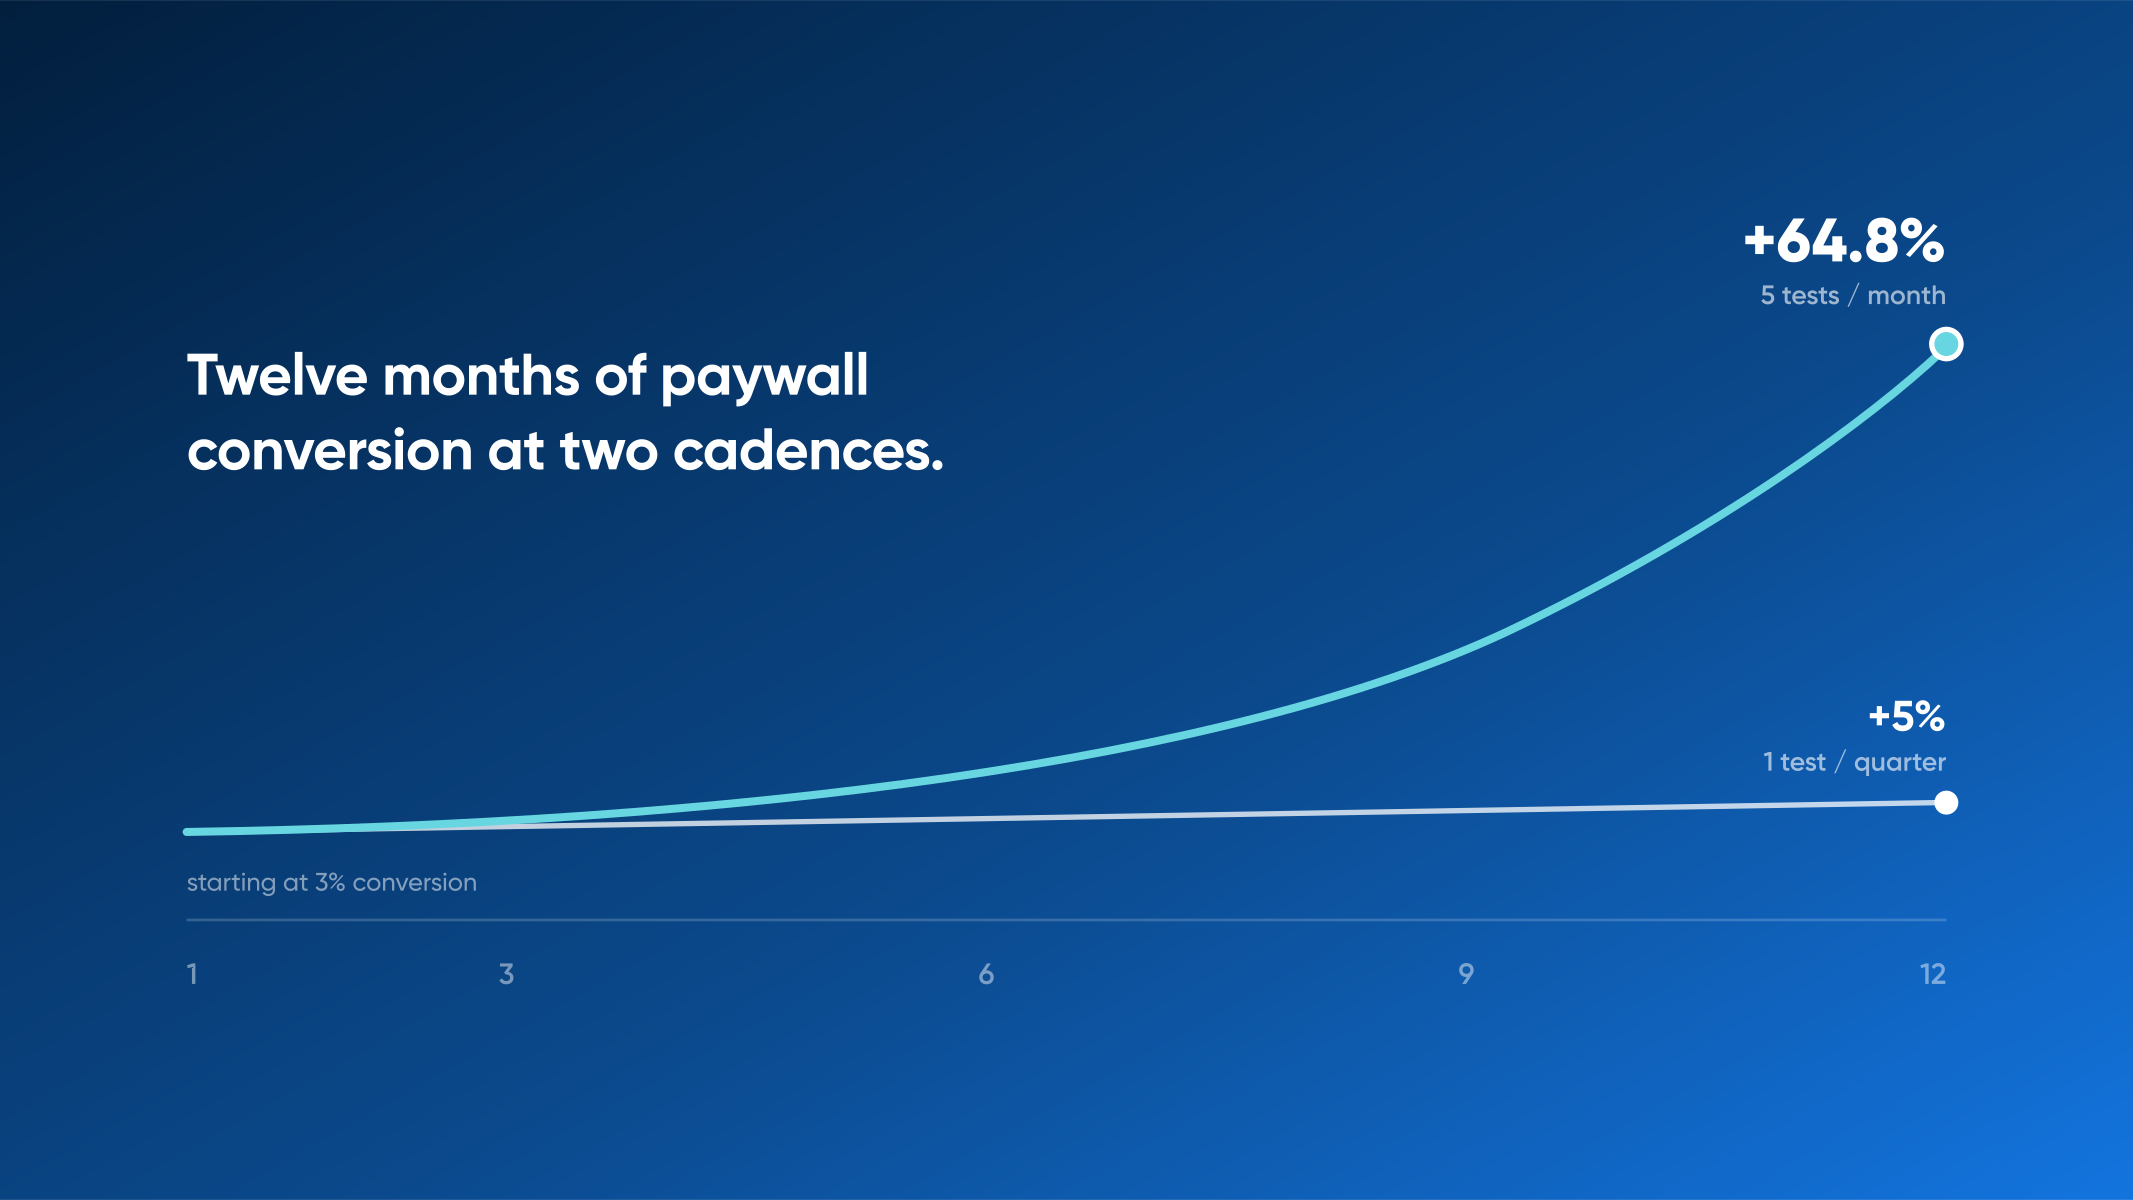
Most subscription teams know what to test. The bottleneck is the release window. Here's how A/B testing paywalls without an app release changes the math.
Connect what your team builds in Nami — the pages, flows, and campaigns subscribers move through — to the outcomes that actually move revenue. Subscription-native metrics segmented by SKU, placement, campaign, page, and more. Where event-based analytics tools fall short.
Most subscription teams already pay for event-based analytics, billing reports, and campaign-tool dashboards. What no one has built is the layer that connects them. Event tools capture clicks and sessions; they don't natively model paywall conversion, trial-to-paid, or subscriber state. The team ends up with three dashboards and no honest answer to what just happened in the funnel.
Three dashboards → one funnel.
Revenue, paywall conversion rate, trial starts, purchases, impressions, unique viewers, active devices, failed notifications, and more. Subscriber-aware metrics named for the funnel you're optimizing — not generic event counts you have to reverse-engineer into a subscription story.
Slice any metric by product SKU, platform, country, campaign, placement, campaign segment, or page. See which offering converts best on Roku. See which campaign produced the highest trial-to-paid rate. See which page drove the most revenue in Germany last month. Every cut is a question with a direct answer.
Pull hourly resolution when a new campaign goes live and you need to know if it's working tonight. Pull yearly when reviewing subscriber growth at a board level. Insights adapts to the rhythm of the work, not the reporting calendar.
iOS, Android, Apple TV, Roku, Fire TV, Samsung, LG, Vizio, Xbox, Google TV, Chrome, Safari, Edge — every Insights metric breaks down by surface, so the team can see where each platform stands without leaving the dashboard.


Millions in revenue uplift across our customer base. Insights makes the path to that revenue legible — subscriber-aware metrics tied to real conversion behavior at the experience layer, not generic event data.
Insights is the measurement layer that turns subscriber behavior into actionable data.